PALAEONTOLOGY[online]
Palaeontology on the Web
Home
Article by Categories
Education and Outreach
Fossil Focus
Life as a Palaeontologist
Patterns in Palaeontology
Perspectives
Glossary
For Authors
Authors Style Guide
About Us
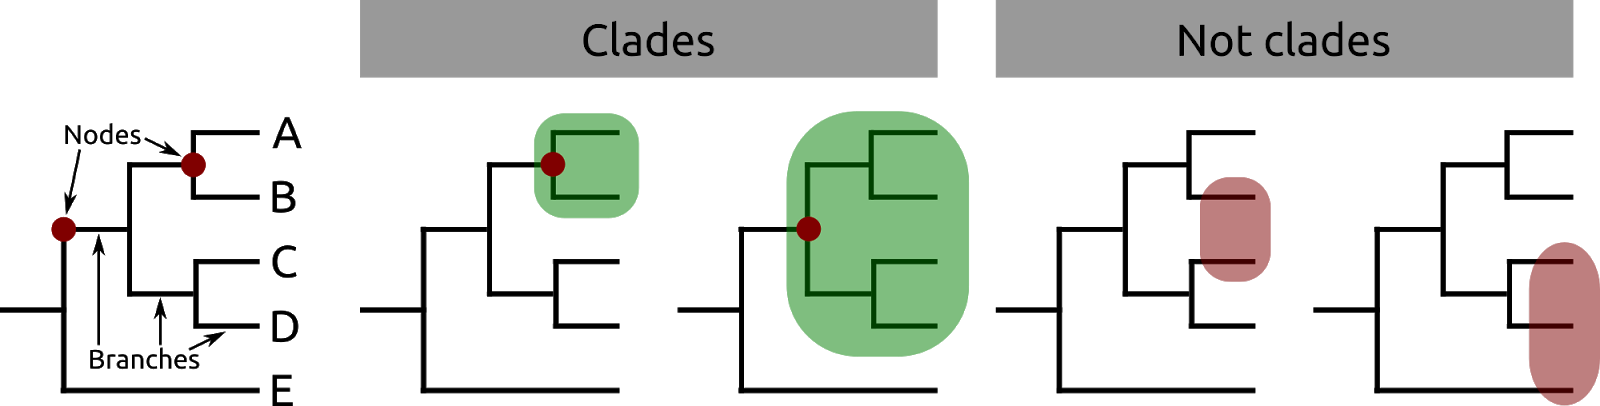
Figure 2
Prev
Patterns in Palaeontology — Deducing the tree of life